3D Imaging Best Practices
By: CascadeOur most recent webinar was hosted by Kerry Stonestreet,Cascade's data management and visual visualization leader. He is a licensed, professional geologist with 18 years of experience combining geologic principles with advanced geospatial and spatial, temporal technologies. He has extensive experience in ESRI's ArcGIS suite of software, C Tech's Earth f Volumetric Studio, and its predecessor's versions, Environmental Visualization System and Mining Visualization System.
INTRODUCTION
This webinar is on 3D imaging best practices, and specifically, how those practices relate to the development of robust conceptual site models, as well as how they support informed decision-making, resulting in cost avoidance throughout the lifecycle of the project.
Here is a simple outline for the blog:
- Best Practices
- Covering the practical aspects of data management analysis and data modeling.
- Benefits and Risks
- Confidence in the Decision-Making Process
- Covering Applications and common misapplications of 3D modeling.
Conceptual Site Model Overview
A holistic CSM is not necessarily limited to the data generated on site., A thoroughly developed CSM includes all appropriate and useful information about the site and the region surrounding the site.
Typical off-site data sources include local, state, and federal data sets. We’ll cover data sources and how they really help build a good model. The CSM, as a platform, guides data collection, analysis, research, planning, and ultimately decision making.
Ultimately, the CSM serves as a platform for discussion and planning, and it's continuously updated as new data and information becomes available. Additionally, the CSM tells a story of what we know and it helps to suggest a lot about what we don't know.
CSM DEVELOPMENT
We endeavor to incorporate all available and relevant site information, whether it’s site-specific or not. A CSM represents the most complete understanding of site conditions and it's dynamic - continuously updated and revised as new info is made available. CSM's may be presented in many formats:
2D DEPICTIONS
- Maps
- Graphs
- Cross sections
- Iso contour maps
3D DEPICTIONS
- A static 3D sketch with generalized geology and receptor exposure route
- A more sophisticated 3D CSM could include cutaways through the geology, plume volumes and preferential contaminant pathways
When all this is managed correctly in a Geographic Information System (GIS), a structured database, and combined with other geospatial and data management tools, a CSM becomes a really powerful tool throughout the whole project lifecycle. Work plans, reports, statistics, tables, maps...all those things are quick to develop and it becomes easy to pull those together when it's all organized and the workflows are the same from project to project.
Finally, the conceptual site model is the primary tool for decision making. We like to say that the decision is only as good as the CSM and the ability of the decision makers to understand and incorporate it.
DATA FUSION
INCORPORATES ALL AVAILABLE AND RELEVANT SITE INFORMATION
A conceptual site model represents data fusion. It integrates all possible information - physical, chemical, biological processes, physical structures (such as subsurface utilities, unusual soil fill or debris) and surface hydrology (strange water bodies, both surface and subsurface) - whatever is important enough to impact a potential decision down the road should be incorporated into the site model. Anything capable of affecting subsurface processes and containment at picking transporting should be included as best as possible.
DYNAMIC
LIKE ANY THEORY OR HYPOTHESIS, SHOULD BE TESTED AND REFINED
CSM’s are dynamic. They’re in a constant state of development. As a new data becomes available, it’s incorporated into the CSM in near real-time. When your data and workflows are structured, it makes it easier to get these things into the database quickly so anyone can take advantage of that. At any point throughout the project life cycle, the CSM is a theory and should be treated as such.
The CSM represents our understanding right now, but if someone has another hypothesis, we’ll explore it and look through the reports. Is there something we missed? A typical project team generally includes chemists, engineers, geologists, risk assessors, subcontractors, and more. So you should solicit feedback whenever possible and take advantage of the vast skillsets within your team.
Additionally, many projects have a public relations component and CSM's are an invaluable tool to communicate very complex scientific principles.
Another benefit of a GIS-based CSM is the relative ease of updating, revising, and generating scenario specific variants. For example, for a public meeting you probably would not want to show 1200 soil samples posted and labeled with a visual, but you can if need be. If you needed to communicate an enormous characterization effort that’s occurred up to this point, you query the database, you put that into a model or visual with your GIS, and there you have it.
ITERATIVE
BECOMES INCREASINGLY QUANTITATIVE AND DECREASINGLY CONCEPTUAL
In its early stages, the CSM is more conceptual than quantitative. It takes time to incorporate decades of data from previous efforts, and in its earliest stages the CSM will begin to reveal likely data gaps. These gaps could be from raw data from a previous report, or perhaps an important comment from the longtime facility operations manager... it all goes into the CSM.
As a side note, let’s talk about what a CSM is not:
Some people get wrapped up in thinking that they have a conceptual site model based on a single or a limited data set, such as a 3D model of a mid-data set. A lot of digital data is useful, since it can be utilized right away, but on its own, it’s just one piece of the overall model. The same is true of monitoring well networks and quarterly/annual sampling plans; it’s good information but it doesn’t define your whole conceptual site model. It doesn’t define the processes or give you enough valuable information to make a really great decision.
HISTORIC SITE DATA
Historic data is always extremely valuable. Most of these facilities and sites that we work on are multi-generational sites. A lot has occurred and a lot has changed throughout the years. We can grab the aerial photos and geo-reference for reference material, in case any questions pop up. Aerial photos and USGS Topos are typically available at no cost.
Previous Reports
If you're a data person, or you have data management people, previous reports can be tough, but they’re extremely helpful and at times crucial. You're trying to scrape data from old reports because, like it or not, there’s still a lot of useful data there. It makes no sense to repeat previous work when somebody’s already done it. Yes, analytical methods change, detection limits change, but there’s still a lot of value to previously collected data.
Trying to find things like well construction information can be very frustrating. We're building these 3D conceptual site models and we spend a lot of time digging through things trying to find a particular data point, when previously, 3D CSM’s were not as widely utilized, making that data hard to find.
Historical Data Example
Here’s kind of a site-specific case study.
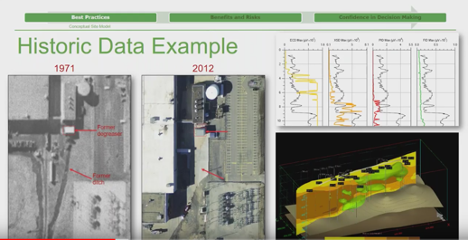
On the left there’s a 1971 black and white aerial shot. On the right, a contemporary color image from 2012. At the facility, the little marks drawn around that structure indicates a tiny metal degreasing shed. There was a former degreasing operation at this site. This was a site which had been worked on periodically for 20-some years. You can see on the left it appears to be a drainage structure. Sure enough it was. On the bottom right image, there's a white line that we digitized on the photo, and then we planned some proposed locations right down it. We were doing a kind of combined MIP and collocated soil boring event and sure enough the first hole we put probably maxed out the sensitive VCD detector. It was completely saturated in about two feet as it went through the concrete, because this site has not been paved over since then. This is a strong example of pulling all this stuff together, and creating a really strong early Conceptual Site Model as standard practice.
Local, County, State, and Federal Data Sources
Other data sources often include:
- Orthophotos
- LiDAR
- Geology water well permit database
- Weather
- Hydrology
- Floodplain
- Parcels
- Utilities
- Survey benchmarks
- EPA facilities,
- LUST
- Dry cleaner
- Soils
Other data often come from sources that aren’t necessarily specific to the site. There's a ton of data out there for free or very low cost. Orthophotos, for example; LiDAR light detection and ranging makes for really nice digital elevation models, which are quite useful of course. The state’s Water Well Permit Database is also a great place to look for extra data. Most of the states we've worked in have a water well permit database and they’re getting more and more sophisticated all the time, including well construction information and geology. Other sources include parcels from the County Assessor, utilities from the engineering department for the cities, and benchmarks from any regulated facilities. A lot of states or EPA facilities now have good GIS data or spatial data.
Site Data
- Contractors: Laboratory (EDDs), Surveyor, Geophysical
- Field Collected: DGPS, Boring Logs, Real-time sensors, injection events, pump tests
This, of course, is all standard data you’d typically hope to have when you’re creating a 3D CSM, including data collection activities that are happening concurrently or have happened recently.
CSM SUMMARY
From a data management and analysis perspective, we've listed sources of off-site and on-site information, showing how they can be incorporated at various stages of the CSM development as well as the dynamic nature and ongoing refinement process that part of development.
Ideally, the CSM is a vehicle for consensus, helping everyone to understand the site in the same way. If it's not, and there are disagreements among stakeholders, it often suggests an insufficient level of data to elucidate a particularly contentious aspect of the job site. Sometimes, the data may just be improperly represented.
As mentioned earlier, the CSM is the primary tool for decision making; the decision is only as good as CSM and the ability for the decision makers to understand and incorporate it. Often, the reason for underperforming or failed remedies is a result of an inadequate or incorrect conceptual site model. Money spent on the development of a good CSM is an investment in cost savings. During remediation and long-term monitoring, the use of this type of tool for real-time stakeholder involvement is key. Another benefit is reduced cost; by minimizing successive mobilizations and the associated multiple work plans, report, analysis, and mobilization costs, you’re able to save a lot of money.
If some providers don't have a good understanding of the whole picture of a site, the outcome is quite likely to be very limited and that could be misleading.
It's easy to make, and it really facilitates sharing, planning and collaborating. The same platform that this is built upon is accessible from your phone and pretty much any web-based browser, so you can utilize this tool on-site, or from anywhere.
For more on conceptual site models, check out our webinar: Remediation Cost Avoidance Through Development of Hydrogeology-Based Conceptual Site Models.
Data Management
Now let’s move on to data management.
Strong data is the only way to have confidence in what you’re building. Data management is not as exciting as the visualization component, but it is the foundation underlying a successful project.
Projects where we receive data from previous work often require more than half of our CSM development and modeling budget. Capturing, cleaning, and evaluating the quality of data does take time.
QUALITY
A separate component of data management is quality. Not all data are the same quality. At one end of the spectrum you have things like PIDs and water parameters, but at the other end, you might have high-quality, high-cost analytical data with the corresponding electronic data deliverables. It's all good information, or could be, especially when combined within a collaborative format.
STRUCTURE
Every project has the same structure. Occasionally you might need to come up with something additional - a new table, or a new field – or perhaps make some modifications to the database, but 90% should be the same from project to project. A lot of things we do are done repeatedly, and that's where the structure comes from.
INTEGRITY
The database needs to be the authoritative data store for the whole project. Six people with 12 different Excel spreadsheets scrambling to make a report doesn’t necessarily instill confidence that a structured, organized data source would provide.
METADATA
It's data about data, not the most exciting thing in the world, but it’s an often overlooked little practice that is extremely helpful. If I geo-reference a figure from an old report to get those locations, another team member may be unsure of where I got that data unless the proper metadata is in place. You need to have some categorical columns in here to track the discrepancies.
AN IMPORTANT GEOSPATIAL FOOTNOTE
Data are associated with a physical location in space in a moment time; monitoring wells are sampled multiple times, data frequency could be measured in months or days. Every sample location requires four coordinates at minimum; X, Y, and Z of course, plus a temporal coordinate, a time stamp. Almost everything has a start/stop date, so samples collected over intervals require two Z coordinates, start,and stop.
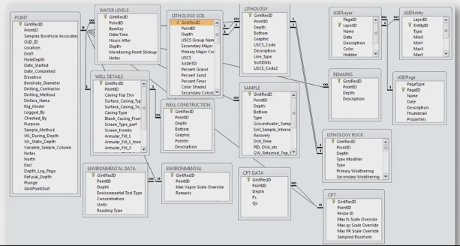
Relational Database Management System
A simple rule of thumb: as far as estimating how much effort goes into the whole development of a 3D CSM is kind of split three ways between the database tasks, the GIS tasks, and reporting tasks.
Data Flow
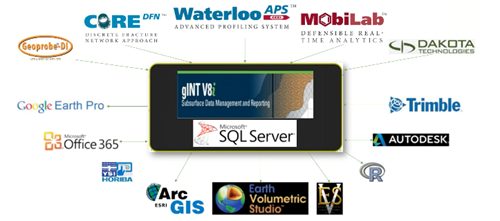
Data sources and client applications
DATA MANAGEMENT SUMMARY
Structured data is the foundation. Structured data creates and enables standardization. Moving from project to project, the process is the same. Client applications can connect directly with the database if you like. The GIS at Cascade can read, write and edit. It’s not just for making maps; if you’re doing it right it’s all about creating a spatial data representation and managing data analysis.
Structured data and data management helps facilitate data between firms and different stakeholders. It’s very common to have multiple consultants and vendors working together on a single project, so you need to have a solid means of sharing data back and forth. You may have a unique database, but if the data is properly structured and organized it shouldn’t be that hard.
Ideally, you want more time for the analysis and decision making and less time spent scraping data out of various documents. Do it right the first time. The more effort that’s put in upfront the more value it’ll have later in the lifecycle of the project.
Analysis and Modeling
There’s a useful analogy between building a fine piece of furniture and building a fine, useful conceptual site model. There’s the raw material for a both; a conceptual site model’s raw material is data. The tools that you use are the analysis or modeling applications that we talked about earlier. Just like any tool, the end result is dependent on the knowledge and experience of the user. Given the same data, the final product can be quite different depending on the skill of the practitioner.
You’ve got your data, it's organized, it's prepared… let's push some buttons and generate a map to show the client, right? Well, that might not a good idea right off the bat. Most modeling applications appeal to as many users as possible. By doing so they make it easy for those without experience or knowledge at the site to simply accept default settings. For some purposes, like creating an initial map to explore the data, this might be fine as long as you understand that it’s not a rigorous analysis at this point.
EDA (EXPLORATORY DATA ANALYSIS)
First take the data, make a map, examine histograms into spatial distributions, look for trends, and go from there. Ultimately, one great first check is to ask “is my data evenly distributed?” Most of the interpolation methods require that, and if it’s not, you transform your data. One common thing we do with a lot of the data that is within different orders of magnitude is to do a log transformation, which will often normalize the data to make it more appropriate to use.
Here’s an example of an exploratory data set: two different borings that were just a few feet apart that told a different, yet similar story. 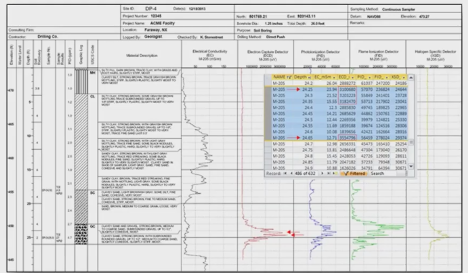
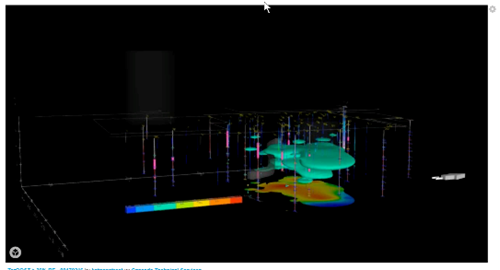
MODEL DOMAIN
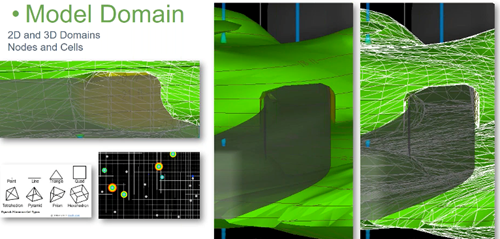
When you use something like EVS, be aware that you’re dealing with cell sizes. When you turn it on, you’ll see the outlines of your 3D mesh. These little 3D shapes are what capture or hold your data. It's where all the predicted concentrations, uncertainties, and confidences, are stored and managed. EVS stores and manages data on the individual nodes, which allows you to manage data on a much more refined scale.
This image shows a green plume, which is TarGOST responses, and the big swath is a big storm sewer that went through the site, allowing you to see the true volumetric nature of EVS.
INTERPOLATION METHODS
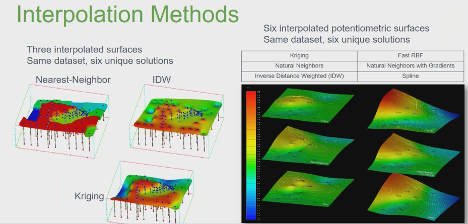
Take a look at the image above and you’ll see that the exact same data set resulted in different solutions. The right and left series are 2D surfaces, which illustrates how you need in-depth data and information. If someone hands you a finished map, you need to know what they did and how they came to that conclusion.
Confidence in Decision Making
The whole point in pulling together all of this data in a single 3D CSM is that it bolsters confidence in decision making. We save money, we manage uncertainty, and we find ways to increase efficiency and reduce repeated processes.
Join our newsletter

A bimonthly email with the latest expert insights in drilling and remediation