PROJECT HIGHLIGHT
HIGH RESOLUTION SITE CHARACTERIZATION (HRSC) TO OPTIMIZE A SITE IN BOTH PRE- AND POST-REMEDIATION
Environmental professionals understand the importance of proper site characterization prior to implementing remedial actions at a site. With an adaptive management approach, project managers use continued characterization throughout a project’s life cycle resulting in fewer, more targeted injection events and stronger remedial results. Adaptive management uses a continuous flow of site data on which to base decisions and adjust a remedial system in near real time.
PRE-REMEDIATION MIHPT INVESTIGATION:
APRIL 2017
MIHPT HRSC technology was used for site characterization at a chlorinated volatile organic compounds (CVOC) site in the Northwest. CVOC mass was identified at 22 feet below ground surface (bgs). Hydraulic profiling pressure and high flow indicated a transmissive target interval. HRSC data are provided as figures in the image gallery to the left.
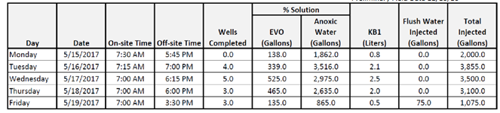
ANAEROBIC BIOREMEDIATION INJECTION: MAY 2017
Injections were performed by direct push at 15 locations defined by the MIHPT detector responses. Approximately 13,500 gallons of bio substrate diluted water were injected into the subsurface. Bioaugmentation also occurred with KB1 at each injection location.
HRSC OPTIMIZED POST-REMEDIATION: JUNE 2017
The anaerobic bioremediation event resulted in CVOC reductions in the monitoring wells, however it was determined the recovery rates could be further optimized. The progress results warranted further review of the MIHPT data. Injection performance was reviewed in terms of total volumes injected, associated pressures, flow rates and monitoring well screen results. Through implementing an adaptive management approach, the project team used both pre- and post-remedy data to optimize follow up injection events. 3D models helped to troubleshoot the overall remediation design and performance for this project are presented in Figures 1-4 below. Based on this data review and modeling it was determined that:
- Injection target intervals identified by MIHPT were consistent with monitoring well screened intervals.
- Injection flows and pressures extrapolated by MIHPT results demonstrated that distribution occurred below fracture pressures to provide optimal contact. For future injection events, continued digital logging of pressures and flows will make it easier to model the actual injection data. This will help to not rely on manually prepared injection logs alone.
- Future remediation events will focus on design volumes to achieve a higher return on investment and impact compliance monitoring wells based on soil type and groundwater seepage velocity.
- Alternative injection approaches to provide contact underneath and adjacent to the building source zone will be developed.
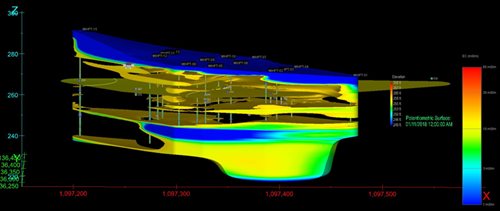
Figure 1 - EC versus Groundwater Surface
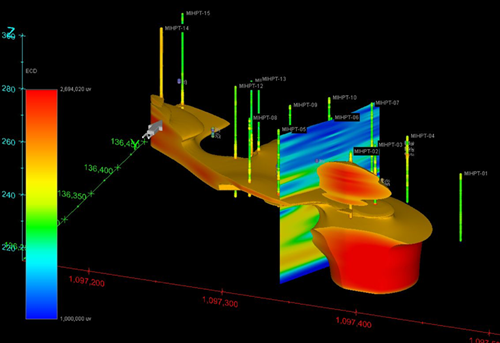
Figure 2 - EDC Responses above 1 x 10+^ uvolts
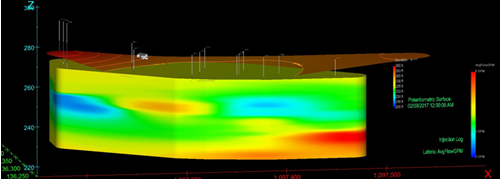
Figure 3 - Injection Flow Rates
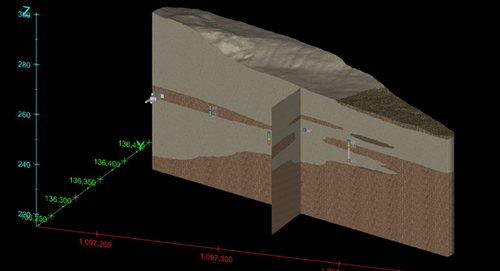
Figure 4 - Simple Geology